The Philosophy of Lockdowns – asking the right questions?

Socrates

I sometimes wonder if philosophy is any use. Maybe it is just a source of entertainment for those who are interested while real life carries on in a different universe. Then I started to follow the lockdown debate and it suddenly became relevant. For example, it helped me sort the difference between a model of lockdowns as a law of nature and lockdowns as an intervention into a complex system – as described in my previous post. It is also helps me (and presumably others) separate different questions and the appropriate way to answer them – a core philosophy skill.

When it comes to lockdowns I see three questions that can easily get confused.

  1. Do lockdowns work in the sense of significantly lowering the infection rate when an epidemic threatens to get out of control?
  2. Are lockdowns necessary? They may well work, but they aren’t necessary if there are other effective methods of lowering the infection rate or if the rate would have dropped anyway.
  3. Are lockdowns are good idea? Even if they are necessary for lowering for infection rate, the costs may be so high they are not a good idea.

The answer to 1) is almost certainly “yes”. There are countless cases round the world where there has been a Covid outbreak, the authorities have responded with a lockdown, and the outbreak has peaked after a few weeks. I am not aware of any examples where there has been a lockdown and the outbreak has continued regardless. Of course correlation is not causation but we also have a very convincing account of why a lockdown would reverse an outbreak – viruses grow through by passing from one human to another and lockdowns limit human contact a great deal.

The answer 2) seems to me to be “it depends on the context” and “how long are you prepared to wait?”. There are several examples where Covid outbreaks have peaked without a lockdown (Sweden? South Dakota?) and all other virus outbreaks, e.g. flu, have eventually peaked without a lockdown. The reasons seem to vary: change in the weather, local herd immunity, the community changing its behaviour. The trouble is for a decision maker these are hard to predict and may take a very long time. If you have an outbreak in November, you are unlikely to let it rip in the expectation that the weather will turn things around in April. On the other hand if you have an outbreak in March you might take the risk.

The answer to 3) is even more dependent on context and even more complicated. I don’t think we will really know the answer until we see the long term consequences of the lockdowns and the outbreaks. However, I have noticed that discussions often use the wrong sort of evidence. They weigh the harm done by the outbreak – chiefly in terms of excess deaths – against the harms done by the lockdown – economic, mental health etc. What they should be doing is weighing the harms done by the decision to lockdown against the best estimate of harms that would have been done by not locking down. If the lockdown was actually not necessary (see question 2) then this is a no-brainer – clearly the decision to lockdown was a mistake – but if the answer to question 2 is yes, the lockdown was necessary, then we should be balancing harms done by lockdown plus harms done by actual outbreak against estimate of harms done if no lockdown.

This has some interesting consequences for what is appropriate evidence. The more deaths, and the higher the rate of growth of deaths, before the lockdown, the stronger the case for a lockdown, as that is evidence for more deaths if the lockdown had not been implemented. However, the more deaths that occur after the lockdown has been implemented, the weaker the case for a lockdown. These are deaths the lockdown failed to prevent. The same applies to indirect deaths as a result e.g. of having to defer cancer diagnosis. Those that resulted from deferred diagnoses before the lockdown count as evidence for what would have happened without the lockdown. Those that resulted from deferred diagnoses after the lockdown count against the lockdown. Even though the actual deaths may occur months or years later.

I don’t these distinctions being made in most debate on the subject – philosophy recommended!

Do Lockdowns Work? A personal analogy.

A frequent argument from those who oppose lockdowns is that such and such an example (Sweden, South Dakota, insert as appropriate) did not lockdown and yet the virus was no worse than others (Rest of Europe, North Dakota, insert as appropriate) who did lockdown. This leads to much discussion – e.g. Sweden’s citizens behaved as though there was a lockdown and it suffered much more than its immediate neighbours (Norway, Denmark. Finland) with similar culture and climate. That’s all interesting stuff but I want to make a different point.

The argument is based on a scientific model which you might call the lockdown hypothesis. The hypothesis is something on the lines of “the level of lockdown is inversely proportional to the frequency of virus cases given a constant culture and climate”. It is somewhat analogous to Boyle’s Law which could be paraphrased as “the pressure on a gas is inversely proportional to its volume given a constant temperature and number of molecules of gas”. For laws like this a single counterexample is enough to force us to revise the law. If you can demonstrate an example of a gas that does not conform then Boyle’s law needs changing and you pick up a Nobel prize. However, lockdowns aren’t like that. They are interventions into highly complex systems (societies) which sometimes work as expected and sometimes don’t. This is altogether different.

Clearly this isn’t me and she is donating stem cells not having a transplant – but it is the best I could find.

An analogy which seems to work well is a medical treatment and I believe I have an example from my own experience which works particularly well. A stem cell transplant is a very disruptive intervention into a complex system (my body) to address a problem of uncontrolled growth of something bad (my blood cancer). Stem cell transplants are a proven and standard intervention which make a massive difference most of the time. There are also many examples of stem cell transplants with disappointing results and a few examples of patients that go into remission without a stem cell transplant. That doesn’t mean stem cell transplants don’t work. There is a compelling account of how they work – just as there is a compelling account of how lockdowns work. There are countless cases of patients who had cancer and after the stem cell transplant their cancer was much improved – just as there are many, many cases of countries (or states or provinces or whatever) that had the virus badly and after a lockdown the virus was much improved.

With this model individual failures and individual successes without lockdowns do not prove that lockdowns don’t work. It also means that comparing different countries (or states or provinces or whatever) is not very useful – just as there is limited evidence for stem cell transplants comparing the experience of one patient with another. It is much more compelling to look at what tends to happen to a country before and after a lockdown.

There are very few (any?) examples of countries (or states or provinces or whatever) that have implemented a strong lockdown and the virus has not been brought down. The treatment seems to work!

Note that this is about whether lockdowns work. It does not address the different question – are lockdowns a good idea?

Ivor Cummins’ video about Irish TV report on Excess Deaths

Ivor Cummins is a well-known lockdown and mask wearing sceptic who has an active YouTube channel. This short video caught my attention because it is a pretty aggressive attack, and yet I am sure Cummins has made several errors.

The video is about some recent research into excess deaths in Ireland and an Irish TV news item about that research. Excess deaths means the number of deaths in excess of what would normally be expected for a given period. It is one way of measuring the impact of the Covid epidemics.

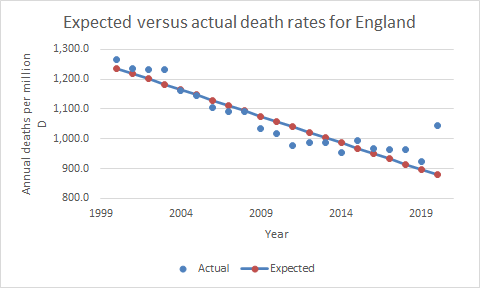
First a few words on calculating the expected number of deaths, which is quite tricky and can be done many ways. Obviously it has to be based on past count of deaths. You probably want to take account of changing population sizes so you need a death rate e.g. deaths/million. (You might also want to take account of changing demographics, especially age. So you might want an age adjusted death rate. However, none of the examples in the video do this.) Clearly you cannot base it on just last year’s rate as rates vary quite a lot from year to year. However, it is also a good idea to allow for trends as over the long term there is a decline in death rates in most countries including Ireland. So the expected rate for the most recent period, e.g. 2020, will be lower than the average for the last few years. This chart illustrates the point. It shows annual actual death rates for England from 2000 to 2020 (because I could easily get this data) .

The overall decline in rates, until the uptick in 2020 for Covid, is clear. The expected rate for 2020 was not the average of the preceding years, it was much lower. What is needed is some kind of regression model to base the expectation on the trend. Here is a model based on simple linear regression (in reality a much more sophisticated regression model is often used). The gap between the actual (blue dot) and expected (red dot) rate for 2020 is a useful estimate of the impact of Covid on overall deaths. You can see how much larger the gap is in comparison to other years where the actual exceeds expected due to things like flu outbreaks.

To return to the video. It appears that the Irish government doesn’t publish timely expected rates. They appear months or even years after the deaths occurred. (It is a bit surprising. Public Health England publishes weekly expected rates, the last report at the time of writing was two weeks ago – April 9th). However, two Irish academics have done their own calculations showing two excess death peaks for March 2020 and March 2021, corresponding to the two Covid waves in Ireland. The Irish TV programme is a short report on that research.

Cummins thinks their approach is wrong and more or less accuses the academics of intentionally misleading the public. Oddly, to make his case he does not use any charts of Irish excess deaths. He starts by using this chart:

This is a very useful chart but it is quite complicated and subtle and I am not convinced Cummins understands it. Euromomo was founded to track deaths due to flu outbreaks and similar events. The “Baseline” rate on the chart is the expected rate based only on years where there were no “additional processes” leading to excess deaths. Additional processes is mainly flu outbreaks but also 2020 because of Covid and some other rarer events. (I am not sure what the “Substantial Increase” line means – presumably some additional years are included). This provides a handy way of showing excess deaths due to those additional processes – most recently Covid. Cummins uses the chart to try and show the seasonality of excess deaths i.e. there are more excess deaths in the winter when flu happens and less in the summer. As it happens the Euromomo chart illustrates quite nicely how much larger the excess deaths due to Covid were than the excess deaths due to flu outbreaks, but that is not the main point. The research project Cummins is criticising doesn’t use the same approach to estimating expected deaths as Euromomo. The expected death rates are for Ireland only and do not exclude “additional processes”. They also estimate death rates on a quarterly basis. Therefore the excess deaths will show no seasonality.

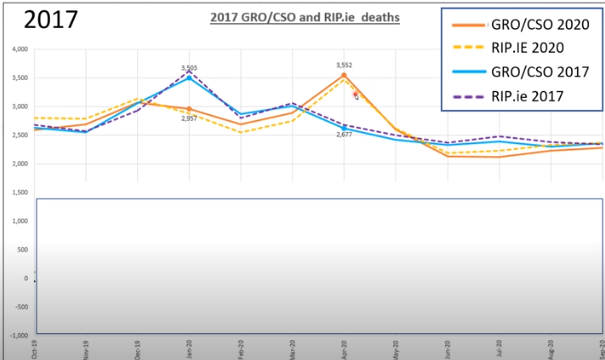
You might expect Cummins to then go on and examine the research he is criticising. But he doesn’t. The next step is to compare 2017 to 2020 actual deaths. This is quite interesting but irrelevant to work on excess deaths that he is criticising.

This is his chart (poor quality because copied directly from video):

It is true that the actual deaths in 2017 are very similar to the actual deaths in 2020. Also the rate of peak deaths is similar. But remember that these are actual not excess death rates. 2017 was a high flu year, while 2020 had almost no flu. Also the trend was for death rates to decline. 2020 should have been a lot lower than 2017 but something, almost certainly Covid, made it much the same. Also the 2020 spike was in April while the 2017 spike was in December. So if the chart was meant to make a point about excess deaths it rather disproves the thesis that excess deaths are seasonal.

Then there is some stuff about what would the figures have been had there been no lockdown. That is of course a key question but it is a whole different debate. There is no scope for addressing it here but personally I don’t think cross geography comparisons prove much unless geographies are very similar. I believe lockdowns sometimes work very well and sometimes work less well depending on all sorts of things including, but not limited to, the specifics of the lockdown, the way people respond, demographics and weather at the time.

In summary, it is not entirely clear what Cummins point is but I think he is claiming that the excess deaths project is faulty because it only includes two peaks and the time between. He thinks it should have included the whole of two years so as to include the non-peak time of year for both peaks. However, this would have added nothing. As discussed above, depending on the way the project estimated expected deaths, excess deaths may not be seasonal at all. But in any case the project is not making a claim about excess deaths for whole years. It is simply pointing to two periods when excess deaths were extremely high. As it happens, if you look at the Euromomo chart you can see there was very little difference between actual and expected deaths outside of the spikes, but that is barely relevant.

PS Does Irish official data on excess deaths really lag months or years? Public Health England publishes them weekly – the most recent being week ending 9th April.